
After the expansionary fiscal packages of 2020, the macro-legacy will be debt build-up, which was amassing even before Covid-19 and the Russian invasion of Ukraine. Stubbornly high government debt ratios now look inevitable for 2022 and beyond. Figure 1 shows them in both gross and net terms, where the latter excludes sovereigns’ financial assets, ownership, loans and gold.
Even in 2019, prior to the necessary fiscal stimuli, US, euro area and UK government net debt averaged 77% of gross domestic product – more than twice Japan’s (34%) when it entered its lost decade in the mid-1990s. Japan gets away with it by having its government bonds denominated in yen and held predominately (97%) by domestic investors less sensitive to yield and foreign currency ratings. Thankfully, the US, euro area and UK bonds too are in local currency, implying default risk is next to zero. This offers an extra incentive for euro area members to stay in the club.
This gives governments (especially those facing voter enmity) time to capitalise on low funding costs, to keep growth and inflation considerations ahead of more direct ways (tax rises or spending cuts) of addressing debt. Such a relaxed approach would be akin to how the UK dealt with its post-second world war debt burden that started at 250% of GDP. An advantage this time is that it no longer has the US dollar-denominated obligations that contributed to Westminster having to borrow from the International Monetary Fund in 1976.
Figure 1: ‘Debt’s all folks!’ – The legacy is debt build-up
Government gross and net financial liabilities as a % of GDP (*1998 data; **2000 data)
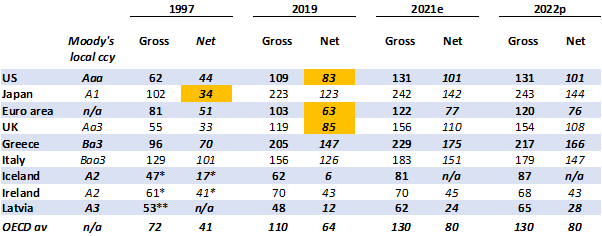
Source: OECD data, estimates and projections, and Moody’s Investor Services
Yet, even with low rates, governments cannot be complacent. First, debt accumulation may gradually drag on growth. Figure 1 shows that gross debt-to-GDP ratios were, even before the pandemic, exceeding the 77% that the World Bank estimated is a ‘tipping point’, after which growth starts to be held back as every additional percentage point of debt-to-GDP clips annual GDP by 0.02 percentage points(World Bank, June 2013). While small initially, this could snowball as debt accumulates. Recent crises suggest that permanent debt reduction may yet need lasting medical and military, not just economic, solutions.
Second, with about 40% of UK government market-held debt being owned internationally, ‘the kindness of strangers’, as former Bank of England Governor Mark Carney noted in 2018, will probably hinge more on yield and ratings considerations when compared to Japan. The UK’s net debt for 2022 will again exceed 100% of GDP (Organisation of Economic Co-operation and Development data), after reaching its highest ratio since 1963. In 2019 it was 85%. Unless growth takes off, the UK would, by 2033, surpass its 250% post-war high if debt continues accumulating around the same pace. Without stronger, sustained demand growth, this would scupper hopes of eroding the debt via inflation.
Third, to not crowd out private sector recovery, debt funding costs will have to be held down if a vicious circle – of lower growth, lower tax revenue and higher deficits – is to be avoided. Here, the debt would matter. Crowding out’s biggest risk, though, is probably when funding costs run significantly ahead of inflation, such as in the 1970s. Unless deflation expectations set in (boosting real costs), this still seems at variance with currently low funding costs, even with the Federal Reserve and BoE flexing with policy rates.
With the printing presses still warm and leaders facing short political cycles, certainly relative to average debt maturities (Japan’s is 10 years and the UK’s is about 16 years), there’s incentive to supress quantitative tightening to avoid throwing out the baby of growth with the bath water of raising taxes and cutting spending. US President Joe Biden and UK Chancellor of the Exchequer Rishi Sunak stand out by having proposed or implemented tax hikes, the former as part of an income-redistribution programme, while the latter risks fanning the stagflationary flame.
Fourth, even if growth is preserved, competing demands on the public purse and the realisation that deficits have to be addressed at some stage, as sovereign credit ratings and bond yields come under pressure (as feared by UK Chancellor George Osbourne in 2010-13), may relegate other priorities, such as infrastructure and green initiatives. One palliative might be to tailor future fiscal action to environmental performance.
Fifth, debt ownership could raise political tensions. One early warning could come as the international blame game for Covid-19 and Russia’s invasion intensify. Bargaining over the US’s gross $31tn (135% of 2021 GDP) debt ceiling after the midterms may flag up China’s $1.1tn claim on it. This could raise friction if China starts beating its chest following its 20th National Congress.
Figure 2: Quantitative easing – as in the 1930s – is no flash in the pan
US long-bond yield and US Treasury Bill rate (both %)
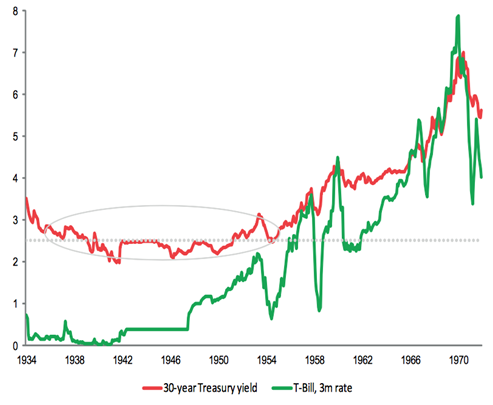
Source: Refinitiv Datastream and US Federal Reserve Board
Any retaliatory renminbi weakening risks imploding China’s corporate and bank balance sheets exposed to dollar debt, so the People’s Bank of China is likely to stem it through capital controls and delving into its $3.2tn of reserves. But wouldn’t this question China’s commitment to buying US Treasuries (15% of international holdings) and, unless offset elsewhere, raise US mortgages typically priced off long yields?
Finally, for many emerging markets, the outlook may be less rosy. The World Bank estimated a lower, 64% of GDP tipping point for EM economies, before the same annual growth hit comes from every percentage point increase in debt. The GDP-loss from Covid-19 and the Russo-Ukraine war will be prolonged in a more protectionist, stronger dollar environment. Vulnerabilities lie with those non-commodity exporters with high exposure to short term external debt and foreign saving needs, such as Argentina and Turkey. For others, external debt ratios are lower with few currency pegs to have to protect. As their domestic debt climbs, they can run QE.
All this suggests QT via debt sales (active QT) will be difficult. If QE’s effects continue to boost asset prices over wages, wealth disparities will widen further. With high bond supply, Japan marks its 25th anniversary of QE next year. In 1951, the US Treasury-Federal Reserve Accord was the reason for stopping US QE after 14 years (Figure 2). This will not be repeated but could appear forgotten, formalising the dependence QE-governments have on their central banks. In a high debt world, a challenge will be keeping clear the operational distinction between the monetary and fiscal authorities, as bond issuance stays high and timidity towards QT builds.
The issue then is whether hyperinflation beckons as institutional credibility is questioned, currencies are debased and memories of the Weimar republic, Argentina after the 1980s and Zimbabwe in 2007 are rekindled.
Alternatively, with ultra low rates and the aftermath of the QE part of the growth problem, a liquidity trap ends up taking us closer to the Japanese route. Either way, with malfunctioning economies, sweeping ever-growing debt under the carpet may eventually trip up policy-makers.
Neil Williams is Chief Economist at OMFIF.